
November 2021

October 2021
To me the ‘canary in a coal mine’ for real estate are the condos. They are always the first to be over built and where we normally see suffer financially first in the market. Meaning if property owners are going to lose out, it will be condos first. These statistics are showing that the condo market is alive and well.

September 2021
The median price is up $80,000 from last September. Time to sell went from 45 to 32 days and there is about 1400 less listings on the market. If you read just the headlines that sales are down, you might think that the market is starting to balance itself out, however, sales are down due to the fact that there isn’t any product.

August 2021
People may think that the market is starting to level out with the sales statistics going down, but that’s not necessarily true. Because there is a lack of product for sale, there will be a slow down in sales.

July 2021
The average selling time for homes went down from 57 days last July to 27 for July 2021. This impact is huge for any buyer trying to get an accepted promise to purchase. It tells a story how in this market, buyers are clamoring for a home.

June 2021
The shocking information this month is the median price for homes. In 2021 it was 395,000$ and this month it is 508,000$. Up 29%! This has a significant impact on buyers and their capacity to keep them in the market or booting them out.

May 2021
Take a look at the available listings for homes in comparison to last year at this time. There is 2773 difference. Statistics aside, as a working real estate broker, I can honestly say that I have never seen a market like this before. There are so many buyers out there who still haven’t bought.

April 2021
Active listings for homes are continuously, month after month, since April 2017, have been going down. Meaning, there is hardly any product on the market right now. What does come up, normally sells within days with multiple offers…if it’s priced right. One thing has changed though, is that there are more condos on the market. 57% higher than this time last year, taking them a bit more time to sell.

March 2021
Don’t be fooled thinking the market is slowing down because home sales are at -7%. The reason is, is because there isn’t any product. Active listings are down -43%. Gone are the days of 2 or 3 multiple offers. We are now into 10-20+ offers. There are so many buyers now who haven’t bought. Are we in a bubble? Are we going to crash? I don’t think so. Not for a very long time. People are still working, immigrants have been stopped coming in, low interest rate, bank security, low housing starts, low product available and on an international scale, our prices are still considered low.

February 2021
Even though sales may be down from the previous year, volume is up. With almost every property sold, due to the multiple offer situation, prices are skyrocketing. Time to sell has gone down significantly. With people lining up around the corner for every new property for sale, brokers are limiting visits to the first week and putting short deadlines for offers.

January 2021
I predict that we will be in this situation for the next 2-3 years until the market starts balancing out. There are still so many hungry buyers who haven’t bought, and the interest rates are still at an all-time low.

December 2020
What a difference in the median price across the board from houses, condos and plexes. Also time to sell is almost cut in half due to the high demand from buyers. I am still seeing on a continual basis brokers, as soon as they list a property, putting a deadline of days to visit and deadline for submitting your offer.

November 2020
Here we are heading into the holidays and the sales and new listings are still going up. I get asked a lot if it is a good time to buy. It’s always a great time to buy.

October 2020
With sales going up, so does the median price. Homes leading the ways at 16% rise from last year, 14% condos and Plexes 2-5 units, 12%. Along with higher prices, time to sell has been going down for some time now. With an average total time for all categories, 74 days.

September 2020
Great news! We are starting to see an incline in new listings. Which means that we are starting to head towards a more balanced market. It may take many, many months to get there though. The look and feel on the street is that it’s not as strong as it was in May.

August 2020
Normally over the last many years, we have seasons. Meaning that the market starts amping up in February until May-June and then is dead for the summer and picks up again for September through to November, and then is quiet for the holidays. Because we are in a strong sellers market, that is out the door. And total sales are up 39%. So for now, any month is a strong real estate season.

July 2020
Sales up 46%, 45% and 34%!! Highest I have ever seen! Everyone thought that après Covid, the market would go down or crash, however nothing has been further from the truth. It is “worse” now than it was before. It is a very strong seller’s market. Days to sell are still going down.

June 2020
New Covid rules are bringing real estate back to “normal”. As a real estate broker, we are back in business. Many professional predicted that the market was going to crash right away, however nothing could be further than the truth. Sales and prices up, time to sell and listings down. Which mean there is hardly anything to buy. Buyers are lining up for visits and most of them have multiple offers within days. How to choose your area, Great Towns to Live In.

April 2020
Well it’s no surprise that during the Covid lockdown that sales and listings went down. Of course they did. It is only logical because real estate brokers were incredibly restricted to actually list and sell properties. The number to pay attention to is the fact that the prices went up and average selling time went down.

March 2020
Well considering we are in the middle of a total shut down, it makes sense that the listings went down by quite a bit. Hardly any buyer is listing their property. As well, sales went well because brokers are finalizing their February deals. The next two months are going to be interesting.
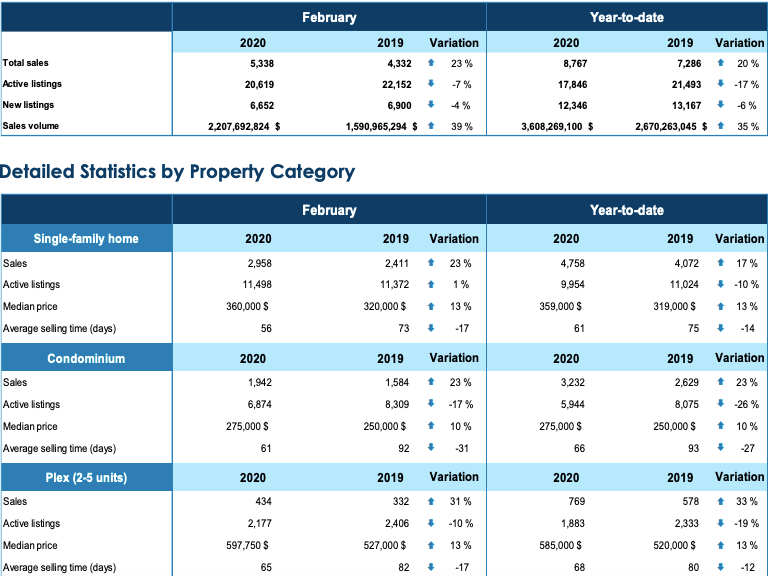
February 2020
Listings went up 1%, first time in 3 years
The fact that listings went up and time to sell has been extended, may be the turning point that we are looking for. The only worry is that there are still a lot of buyer’s who haven’t bought yet. These buyers are flooding to the open houses and still driving the prices up. The time to sell may have extended, however it could be due to seller’s over pricing their property, and then after time, doing a price reduction. With prices going up, the caution is that the overinflated price point are over and above the bank evaluation. Read here for more information: Banks Approving Buyers, But Not Houses

January 2020
The condo market is continuing to amaze me with active listings down -36%. A lot of people think that an undivided condo will have a harder time selling over a divided, however I’ve continually checked the statistics and that’s not true. Over the years, statistically speaking, and from my own personal experience as a broker, the price, the amount of days on market is comparable between the two. For more information on the difference, check out my article: The Difference Between Divided and Undivided.

December 2019
The most impressive jump in the last quarter was the fact that condos are catching up to the rest of the market. A couple of years ago it was touch and go. Meaning a lot of my clients were selling their condos at a loss. The main competition in the condo sector was new builds. It was extremely competitive since a lot of developers were lowering their prices and including appliances and granite countertops. Condo sales were sliding into a buyer’s market. These days condos have jumped back up into competition. For more information on Buying a Condo click here.

November 2019
Increase in the Proportion of Residential Sales in Higher Price Ranges in Quebec: Montreal Area Widens the Gap
Quebec’s residential real estate market, and in particular that of the Montreal Census Metropolitan Area (CMA), are making headlines both nationally and internationally for their exceptional strength, which has led to a generalized acceleration of median prices across all property categories, for several quarters now.

October 2019
For all three property categories, this was the lowest number of properties for sale ever registered in the Montreal CMA since data started being collected.
- In total, 10,850 residential transactions were concluded in the third quarter of 2019, a 13 per cent increase compared to the third quarter of last year.
- This was the highest number of sales in a third quarter since data started being collected by the Centris system in the year 2000.
- For a third consecutive quarter, condominiums registered the largest increase in sales, as condo transactions. Central Residential Statistics.

September 2019
In its latest Housing Observer update, the Canada Mortgage and Housing Corporation (CMHC) examines the reasons and consequences of a decline in new listings in the Montreal Metropolitan Area.
The number of residential properties listed on the resale market has been steadily decreasing since 2016, at an annual rate of 4 to 7 per cent. This trend gives sellers the upper hand, and a further tightening of supply and demand conditions would lead to housing market overheating. Mathematically, a market is considered overheated when the ratio of the number of sales to the number of new listings is greater than 0.70 (or 70 per cent).

August 2019
According to the Conference Board of Canada, the proportion of Quebecers who feel that the time is right to make a major purchase, such as a property, stood at 46 per cent in July, one percentage point higher than the proportion registered last month. This is a slight increase (+3 per cent) in the confidence level compared to July of last year, reflecting the robustness of the current real estate market.

July 2019
“The sales growth that we’ve been witnessing since the start of the year reached a new peak in July with the largest increase in sales since May 2017,” said Nathalie Bégin, president of the QPAREB board of directors. “What’s remarkable is that the resale market continues to be so strong after 53 consecutive months of increases,” she added. – QFREB
Number of properties for sale
The downward trend in active listings that began in October 2015 continued for a 43rd consecutive month, thereby accelerating the tightening of market conditions in a context where sales are setting new records at the same time. In July, there were 16,898 active residential listings on the Centris system, a 20 per cent decrease compared to July of last year.

June 2019
“The year 2019 could mark the peak of the sales and price growth cycle that we are currently experiencing. For the province as a whole, we expect the median price of single-family homes to rise by 5 per cent in 2019”. – QFREB
Strong sellers market
“The strong job market, the continued improvement in net migration and – above all – the postponement of interest rate increases are all factors that have led us to significantly revise upward our outlook for Quebec’s resale market in 2019. We are therefore boosting the forecasts that we presented at the start of the year, both in terms of the number of sales and property price growth”. -QFREB

May 2019
The market is bonkers. Everyone is saying to me, Wow, it must be great for you being a broker. It is…and it’s not, to tell you honestly. My business is half listings and half working with buyers…in a balanced market.
Strong sellers market
Because this is a super strong seller’s market, houses are selling over asking and within days. Which is great when I have a listing. However, since April 2017, listings have been going down every month from the previous year 12-25%.
Listings are far and few
Which means that there are less and less houses for sale. Anything interesting that comes up, on the first day of visiting, will have 30-50 groups show up and probably multiple offers. Which means when working with buyers, you might have to go through 3-6 failed attempts at buying before you actually bag one.

April 2019
Residential Sales in the Montreal CMA Increase for a 50th Consecutive Month in April. In total, 5,973 residential sales were concluded in April 2019, a significant increase of 11 per cent compared to April of last year. This was also the 50th consecutive monthly increase in sales.
Sales by property category
Sales also increased for all property categories across the Montreal CMA. Condominium sales rose by 17 per cent, while plex sales increased by 12 per cent and single-family homes by 6 per cent.
Number of properties for sale
In April, there were 21,111 active residential listings in the Montreal CMA, a 17 per cent decrease compared to one year earlier. “The drop in the number of active listings has created a situation of scarcity, which therefore puts upward pressure on prices,” said Nathalie Bégin, President of the QPAREB. “We see that market conditions have tightened again for single-family homes and condominiums, and have remained unchanged for plexes,” she added.

March 2019
Slight Increase in Residential Sales in the Montreal CMA in March. In total, 5,710 residential sales were concluded in March 2019, a modest 1 per cent increase compared to March of last year. Nevertheless, this was the 49th consecutive monthly increase in sales.
Sales by property category
Across the Montreal CMA, the number of single-family home transactions (3,203) was unchanged compared to March of last year, while the number of condominium transactions (2,079) increased by 5 per cent and the number of plex transactions (422) fell by 5 per cent.
Number of properties for sale
In March, there were 22,430 active residential listings in the Montreal CMA, a 15 per cent drop compared to one year earlier.

February 2019
Strong Sales Growth on Montreal’s Residential Real Estate Market in February. In total, 4,370 residential sales were concluded in February 2019, an 8 per cent increase compared to February of last year. This was the 48th consecutive increase in sales.
Sales by property category
Across the Montreal CMA, the number of transactions rose by 4 per cent for single-family homes (2,436 sales), by 14 per cent for condominiums (1,588 sales) and by 7 per cent for plexes (339 sales).
Number of properties for sale
In February, there were 22,252 active residential listings in the Montreal CMA, a 15 per cent drop compared to one year earlier.

January 2019
My thoughts on why the listings have been down are probably due to the stress test the banks do now for qualifying buyers for mortgages.. As well, if someone decides to sell their house, there isn’t much out there for them to choose from. With multiple offers on the rise and good houses selling within days, people are opting to renovate their houses before moving. I have been getting a lot of calls from home owners deciding whether to renovate by adding an extension or lifting the house to create a higher basement ceiling for a more useful, liveable space, or to instead buy a larger home and so far people are finding it a lot more economical to renovate.

December 2018
The last month of the year is normally a quiet time with most buyers putting their buying dreams on hold till the new year. With the lack of properties available, most buyers have decided to keep their options open in hopes to beat out the crowds. Market is still hot. Good news for condos. Most sales in this domain are picking up.

November 2018
This is a heavy hitting month for sales on the rise and a lack of listings available. You would think that when listings are not available that prices would automatically shoot up. Not the case in Vaudreuil-Soulanges whereas the listings are at -21 and the number sales is lower than all other areas in the Greater Montreal Real Estate Board at -8.

October 2018
Sales have hit an all-time high. This year the market has been extremely different than previous years. With the lack of listings and sales and prices continuously going up, the normal flow of the market has changed. Normally come summers, the market slows down to a halt with everyone away on vacation. A lot of brokers remove their listing, so it doesn’t show that the properties have been sitting around getting stale. Come September, the market becomes active again. This year however, since a lot of buyers haven’t bought during the springs busiest season, due to lack of properties, there were a lot of purchasing happening during the summer, with closing in October.

September 2018
What I’ve noticed is that over the last months, is that condos have made a comeback. After about three years of a lot of sellers losing money, the market has turned up a bit and stabilized. Not quite a seller’s market in all areas like homes and plexes have been doing, but good news for owners considering selling. Now is the time!

August 2018
I think buyers got tired of waiting for product to come out during the normally high season of spring. They just bought regardless, and paid a higher than normal price for their acquisition. August has traditionally been a time when brokers take their vacation due to non-activity.

July 2018
The only thing that is rising these days are prices. Listings still continue to drop since April 2017, and sales are drastically slowing compared to six months ago. I’m also noticing a pattern. If sales are up in an area, normally prices do not follow suit. Meaning, if there is enough product to go around, it doesn’t drive the prices higher.

June 2018
Sales as a whole are slowing down probably due to the lack of inventory on the market. Anything off island, if it’s not too far from Montreal’s core is having more success in sales, especially the Vaudreuil-Soulanges area.

May 2018
I went back a year to compare this statistic with the last 12 months, and honestly, not much has changed. Every month sales are up between 5-17% (average 10%) and listings down 9-17% (average 14%).

April 2018
Prices, and sales up and listings down all across the board…continuing the trend from April 2017. I just received this text message from a broker when I inquired about a 6plex: “Hi, we are presently with 3 offers in negotiations. Was 68 offers in total”. This is an extreme case, however it is a great example of lack of product on the market.


February 2018
The market continues to be a Seller’s market for February 2018. Montreal island is looking great for any Seller, with listings down even lower than the previous months as sales and prices continue to rise.

January 2018
Things heated up big time for January 2018. Sales are still going up and listings down. This has been the trend since April 2017, which is creating an incredible lack of product on the market for buyers. We are now full on Seller’s market.

Dec 2017
Things heated up big time for January 2018. Sales are still going up and listings down. This has been the trend since April 2017, which is creating an incredible lack of product on the market for buyers. We are now full on Seller’s market.

November 2017
Sales are way up (12%) in the Greater Montreal Real Estate area. Higher than I have seen in quite a while. Listings are still holding at 13% down. Plexes have done the largest jump up, which may be due to it being the end of the year for a lot of people’s accounting. The biggest surprise was the jump in sales for condos, especially in Laval and North Shore. The win this month is Vaudreuil-Soulange, where the listings are at the lowest and sales highest of all the areas of the Greater Montreal Real Estate board.

October 2017
What a market these past 6 months have been! Keeping up with the trend, sales are still up and listings are down. The good news is that there are more listings on the market which is creating more active properties to choose from. All sections, houses, plexes and condos are up across the board. Condos are making a comeback and have reached a high, which we haven’t seen in a long time!

September 2017
The trend continues as a buyer’s market. It’s even infiltrated condos, which has been stagnant until now. This does not mean that you just have to put up a sign and you’ll receive multiple offers. Due diligence of maintenance, repairs, cleaning, and staging your house is still very important. As well, creating an appealing listing with professional photos. This is what will make your house that much more desirable over the competition. Pricing your house competitively will also play a large role. Getting the buyers in the door is the first step!

July 2017
We’re continuing the trend of sales moving upwards and listings downward. The condo market is starting to pull away and, besides the South Shore, isn’t doing too well. In the last few months, condos have been trailing behind a bit in sales, however now we are seeing a much larger gap between the homes and multi-doors and condos. I’ve been predicting that condo sales were going to continue the downward trend, and that’s exactly what is happening. Too many listings and not enough buyers. Homes and multi-door on the other hand are thriving. As soon as a descent house is listed, Buyers are running to them with offers in hand, which is driving prices high with quick turn arounds. There are always exceptions of course. For example in the Vaudreuil Soulanges area, homes between $500-650K, seems to be slow and lacking Buyers.

May 2017
It’s a perfect storm for the market to keep moving to a seller’s market in the Greater Montreal areas. Overall sales are up 15% and listings down 15%. Montreal and Vaudreuil-Soulanges wins at an all-time high of 22-25% for sales. All across the board, home, condo, and plex prices are up. To give you an example of what is happening in the well sought-after areas…I tried to book a visit for my buyer to see a house in Pointe-Claire South. The house was listed for $449K on a Monday night at 11pm and had received an offer the next morning at 8am. The real estate broker told me that these buyers had already lost 2 other deals due to multiple action. These statistics are for May, however I feel they still hold true today.

April 2017
Well there seems to be more of a trend of prices up, and listings and sales down. Listings are down by quite a lot. That’s probably the driving factor of the prices going up. Talking to a lot of brokers with buyers, it is slim pickings out there.
South Shore and Vaudreuil Soulanges seems to be doing alright with sales. Condos are still taking a bit of a hit all across the board.

March 2017
This is the first year in a very, very long time that we’ve seen sales and prices up and listings down…across the board. Sales are up 10% and listings down 14%. Each area fluctuates a bit, however this is the trend. When there isn’t much to choose from, buyers will pay a bit more for top quality that is on the market. We’re seeing properties selling faster and with multiple offers. The only area where prices stayed neutral was Vaudreuil-Soulanges. Even though sales are up and listings down, they are a newer community with a lot similar homes in the same era. Their quality and features and style are more similar so as a purchaser there still is a lot of competition compared to a place like NDG where there is more of a mix of styles, renovations and features.

February 2017
Let me just start by saying, sales are up 2%, 3788 and active listings are down 13%, 30,187. Loud and clear! Collectively, prices are all up, including condos. Breaking it down though, there are some areas that took a bit of a hit. Condo prices are down in Laval and the North Shore. Not too bad since sales are up. South shore sales are down, and so are listings, which brings balance.
Sales and listings are down in Vaudreuil Soulanges. In this area houses over $500K are not moving much at all. Not a lot of visits or buyers.

January 2017
Sales are up and active listings are down. Not only are we seeing this through the Greater Montreal Real Estate Board statistics, but in our weekly meetings we’re all noticing that there isn’t much out there for our buyers to choose from. This type of market results in properties selling for more than they might be worth, driving up the market, and creating a turn in the market. There are some areas that are busier than others, that’s for sure, however the general feel of the market is that for homes and plexes, it’s leaning towards a seller’s market.

September 2016
The Island of Montreal is hot hot hot right now. Sales are up, and listings are down. It’s a great time for Sellers. The condo market is still relatively flat with a lot of choices in all areas. Condo construction is still very active. This market jump may be due to investors comparing our market to a lot of other active cities like Vancouver and Toronto. Let’s face it, you can’t find anything in Toronto for under $500K. Compared to our market, you can find a triplex in some areas for that price!

July 2016
The Greater Montréal Real Estate Board (GMREB) has just released its most recent residential real estate market statistics for the Montréal Census Metropolitan Area (CMA), based on the real estate brokers’ Centris, provincial database. In total, 2,685 residential sales were concluded in July 2016, which is a 3 per cent increase compared to July of last year.
Montréal’s Real Estate Market Holds Strong in August, September 2009
Third quarter of 2008: Montréal resale market remains active, November 2008
September Real Estate Market, September 2008
Real Estate Prices Up, Sales Down, November 2007
Strength of Real Estate Market Confirmed by First Three Quarters of 2006, October 2006
14,425 properties changed hands in the first quarter of 2006, April 2006
2005: A Record Year for Home Sales, 2005
Are Real Estate Sales Up or Down?, December 2005
The second best month of November ever recorded by the GMREB, December 2005
Property sales increased by 4% in October, November 2005
Resale Market: A Record Year is Underway, August 2005
3,073 properties were sold in July, August 2005
June’s heat has positive impact on home buyers, July 2005
5,681 properties were sold in April – a record, May 2005
March 2005 – Home sales top $1.2 billion – A record, March 2005
In the long run, homes and plexes hold more value than condos. If you look at the year-to-date median price, house prices climbed the highest, whereas condos did not. However, keep in mind the price point. The higher the price, the more room there is for the value to be higher.